Effect of CT Reconstruction Algorithm on Diagnostic Performance of Radiomics Signature: Prediction of Pathologic Tumor Grades in Pancreatic Neuroendocrine Tumor
Effect of CT Reconstruction Algorithm on Diagnostic Performance of Radiomics Signature: Prediction of Pathologic Tumor Grades in Pancreatic Neuroendocrine Tumor Elliot K. Fishman M.D. Johns Hopkins Hospital |
INTRODUCTION
|
INTRODUCTION (2)
|
PURPOSES
|
Material and Methods: Patients
|
CT TECHNIQUE
|
Image segmentation
|
Image Analysis (Radiomics)
|
Sample Selection Process for Radiomics analysis 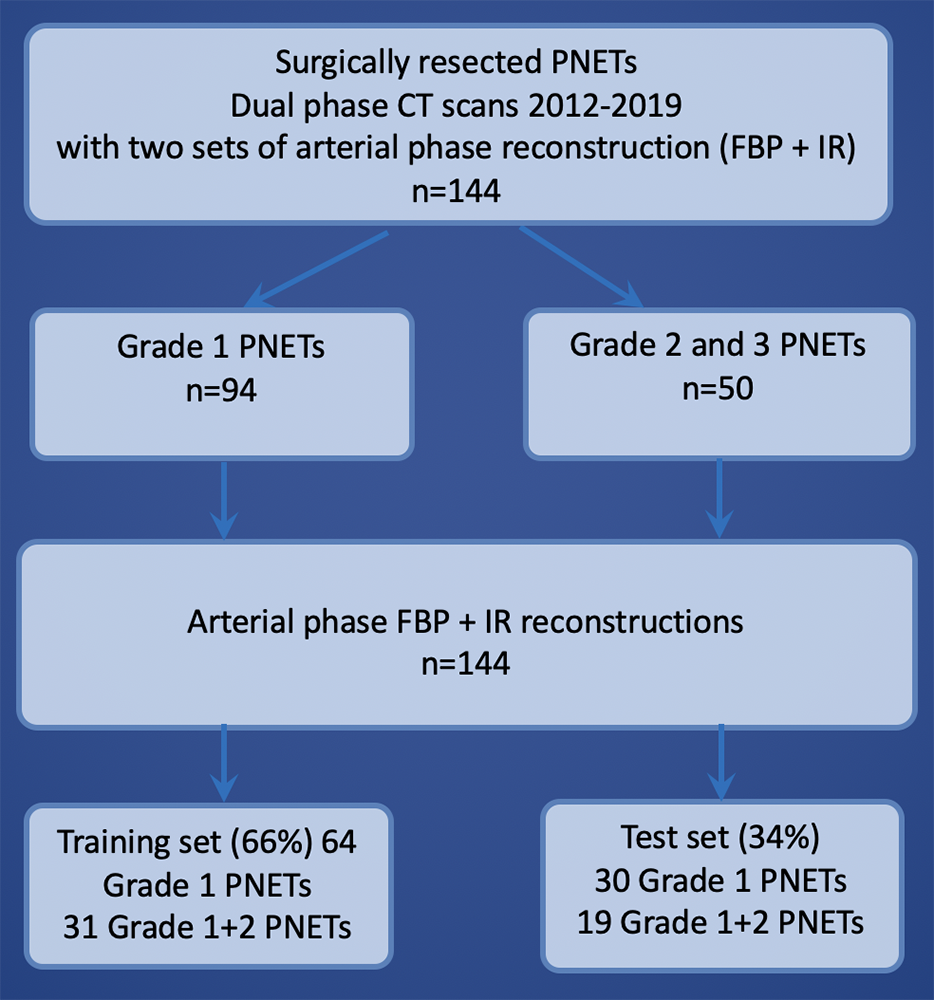 |
Radiomics Feature Extraction Processes 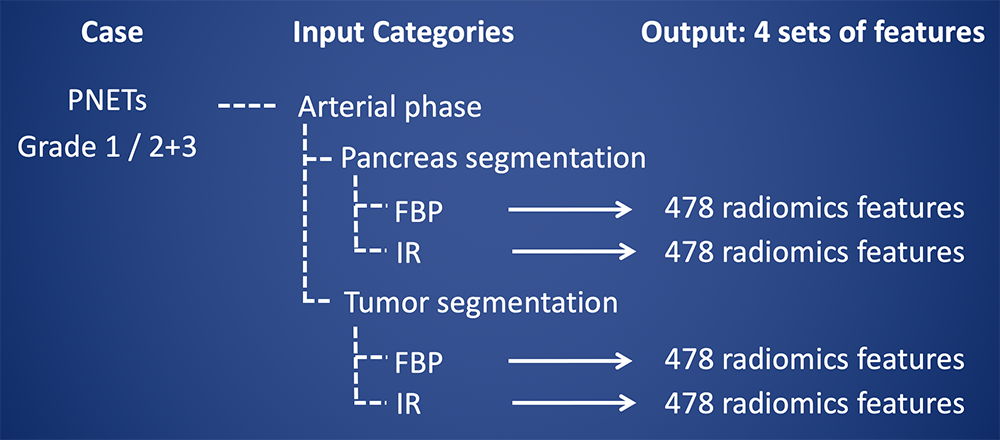 |
478 radiomics features used in this study A total of 478 features were computed from four categories. 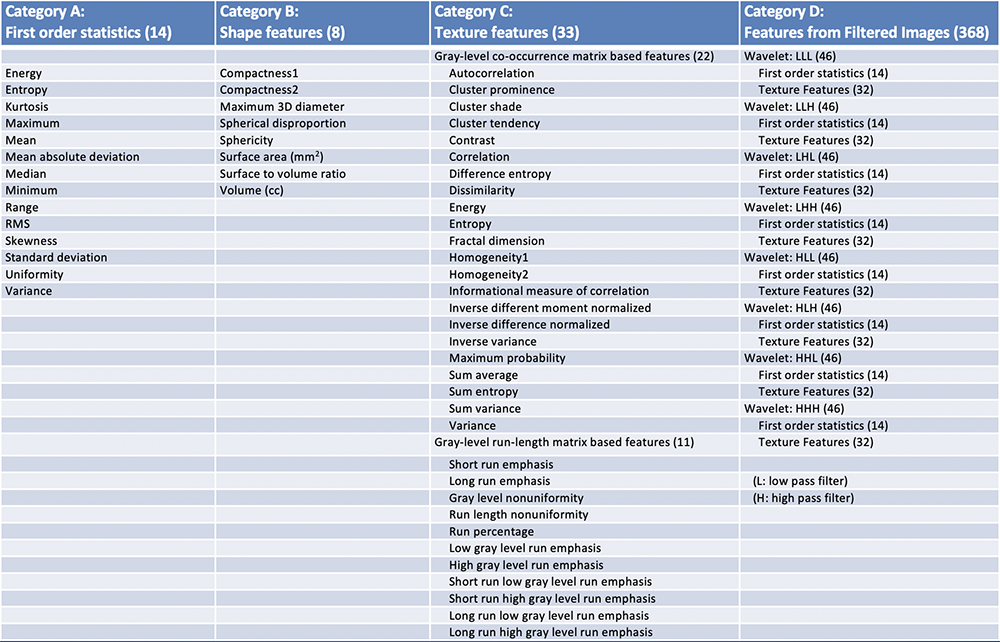 |
CT imaging Features Following conventional CT imaging features were also analyzed.
|
Results: Demographic of PNET cases 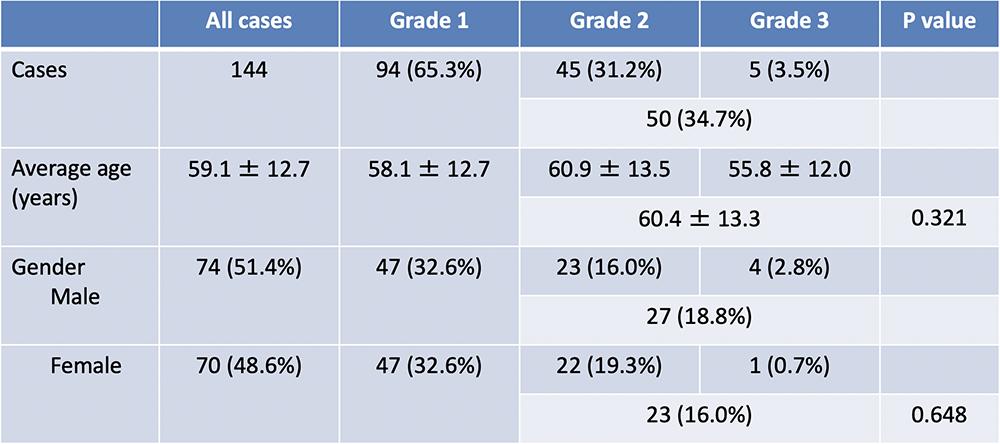 |
Results: Radiomics prediction of PNET grade using entire pancreas and tumor
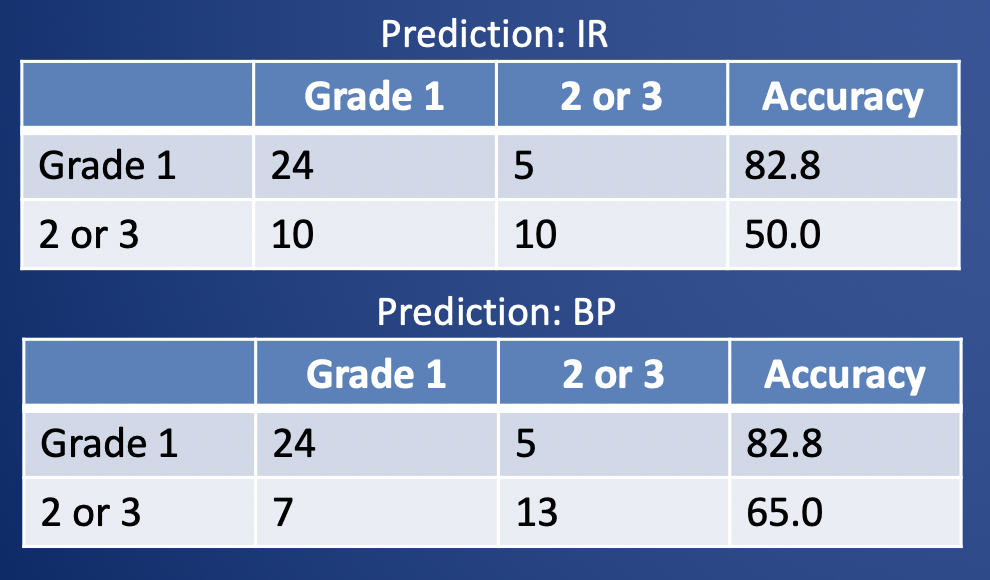 |
Results: Radiomics prediction of PNET grade using tumor only
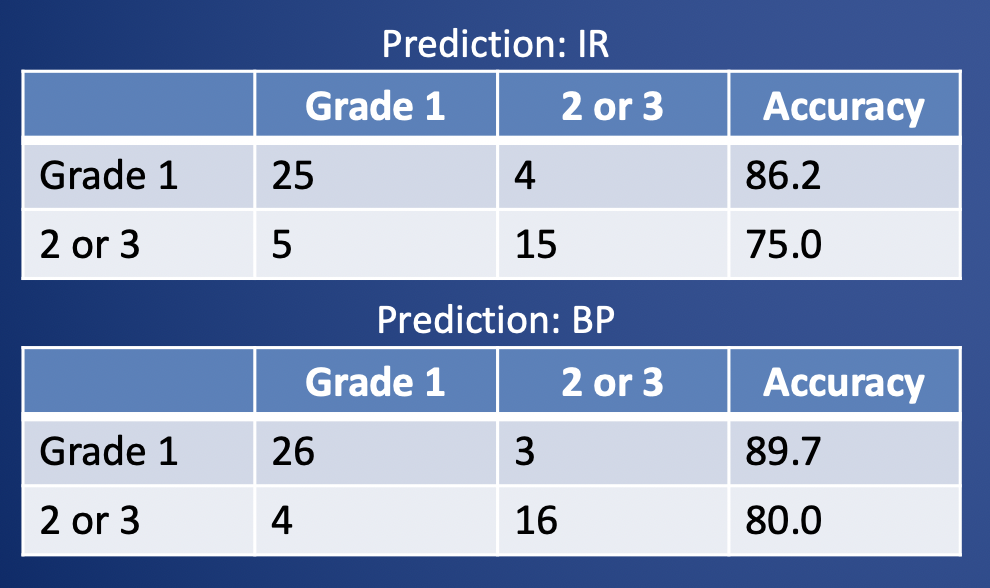 |
Results: Radiomics analysis
|
Example case: 57-year-old man with 2.1 cm PNET (WHO grade 3) in the body of the pancreas seen as a hypervascular mass in arterial phase contrast-enhanced CT. This tumor was misclassified as grade 1 (by both of iterative reconstruction & filtered back projection). 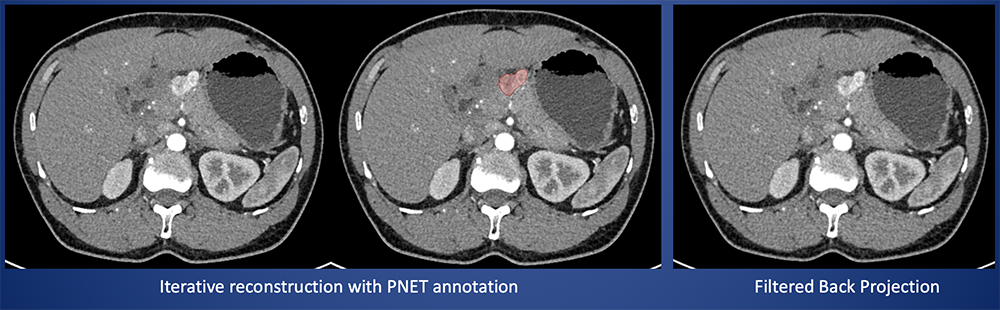 |
Results: CT image characteristics of PNET (1) 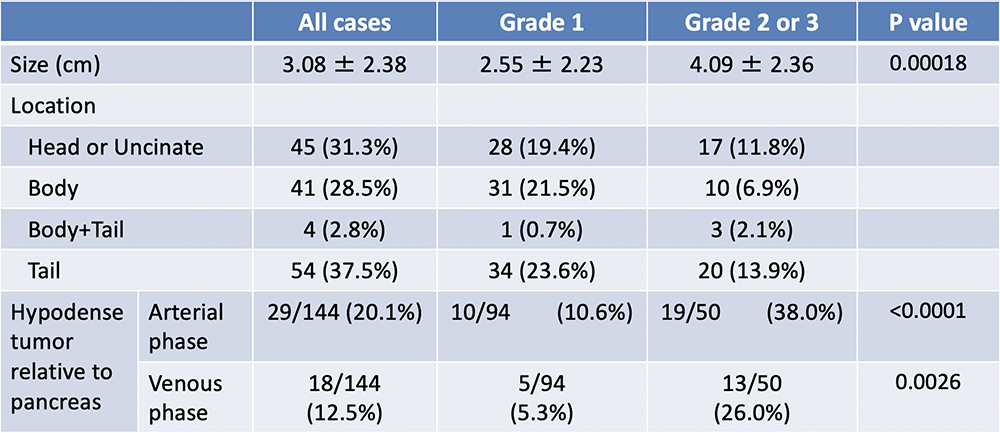 |
Results: CT image characteristics of PNET (2) 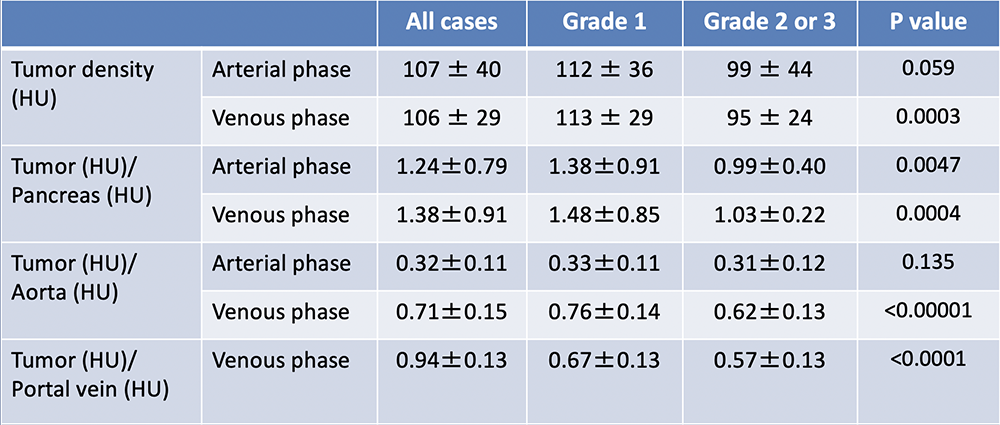 |
Results: CT image characteristics of PNET (3) 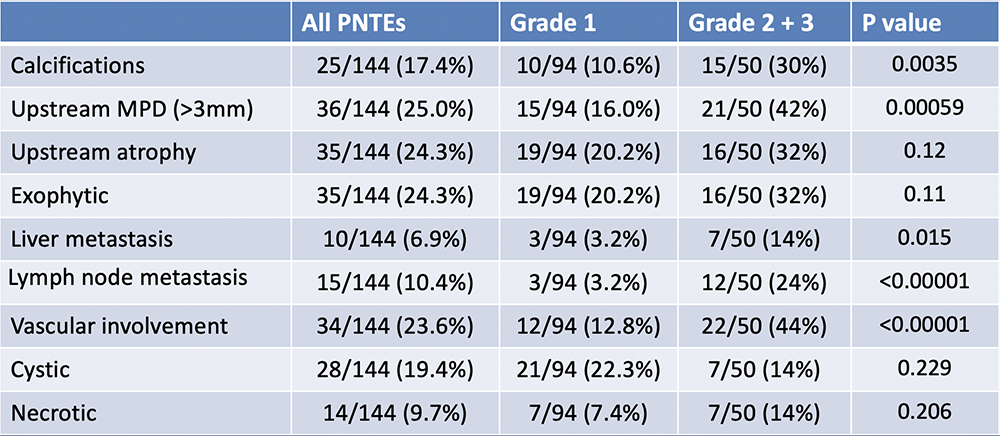 |
Results: CT imaging characteristics
|
Discussion
|
Limitations
|
Conclusion
|