Characterization of Pancreatic Serous Cystadenoma on Dual-Phase Multidetector CT
Characterization of Pancreatic Serous Cystadenoma on Dual-Phase Multidetector CT LC Chu, MD Johns Hopkins University |
Introduction
|
Introduction
|
Purpose
|
Methods
|
MDCT Protocol 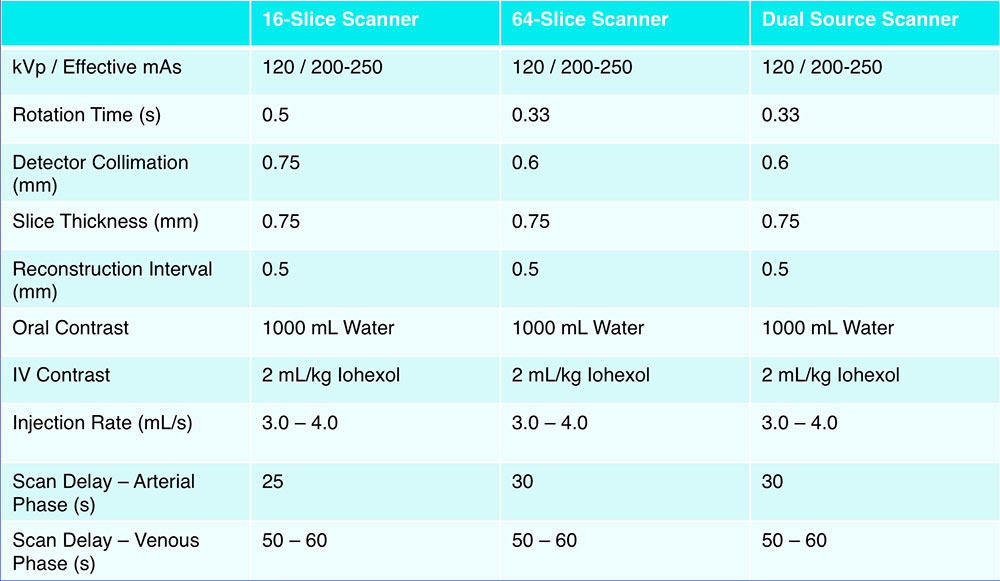 |
Qualitative Assessment All CT examinations were retrospectively reviewed to determine location, size, and morphologic features of the serous cystadenomas:
|
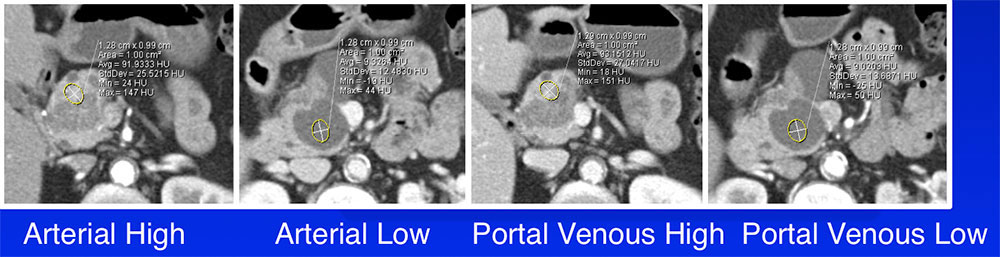
Quantitative Assessment Quantitative CT attenuation measurements using a 1cm2 ROI:
 |
Results
|
External Margins 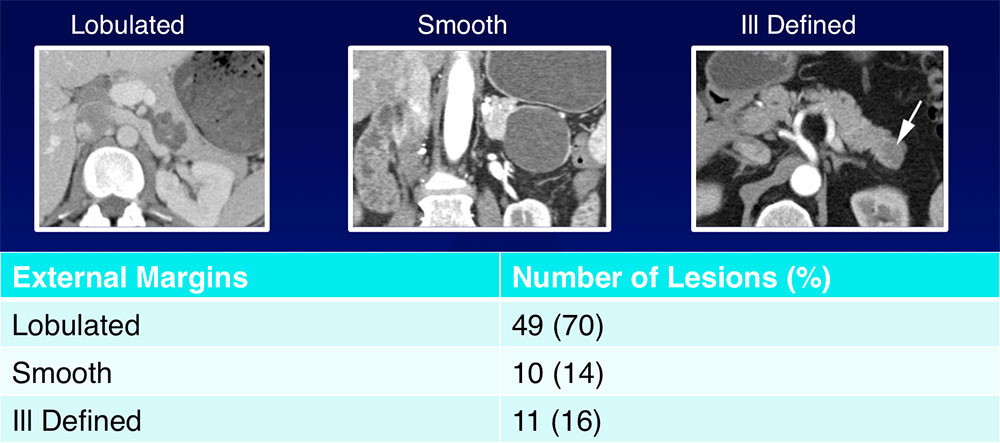 The majority of SCAs (70%) had lobulated external margins |
Internal Septations 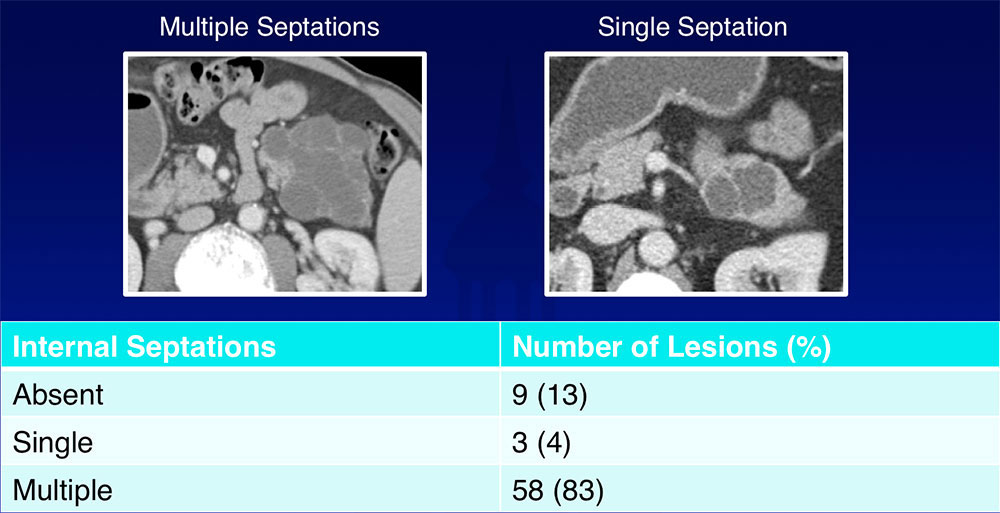 Most of SCAs (83%) had multiple internal septations |
Internal Calcifications 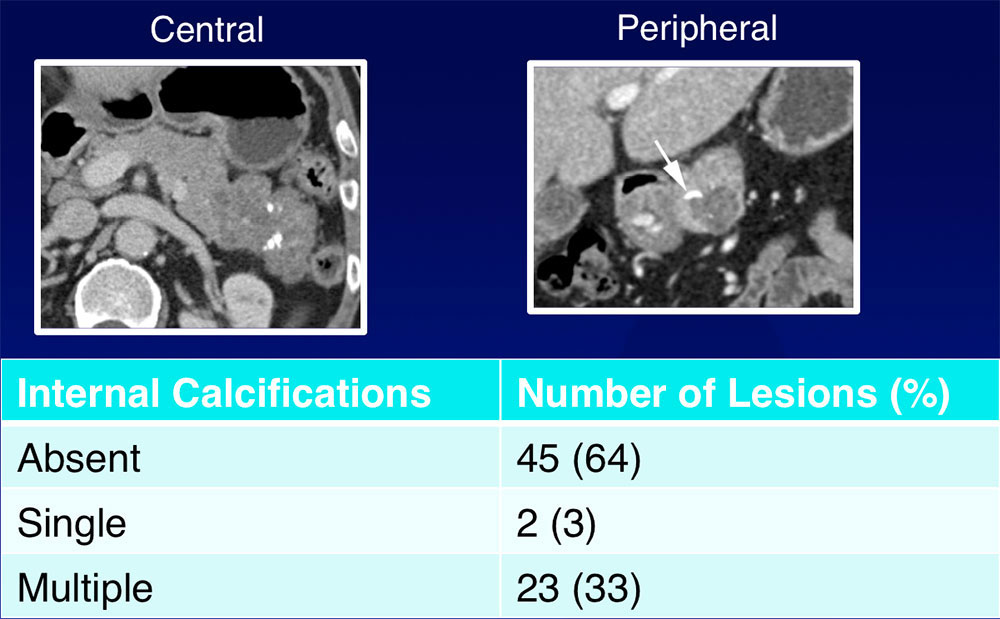 36% of lesions contained internal calcifications
|
Peripheral Rim Enhancement 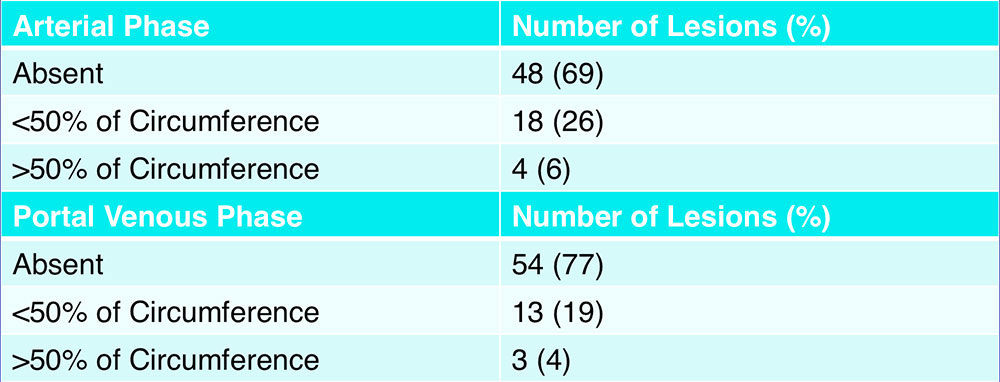 Peripheral rim enhancement was present in less than one-third of lesions on both arterial phase and portal venous phase |
MPD and CBD Dilatation 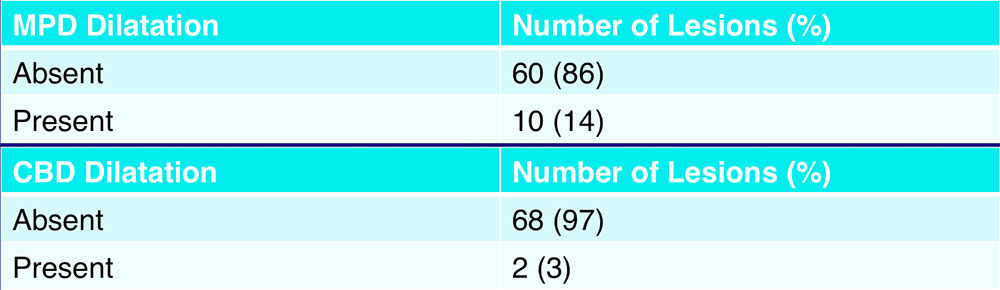 Dilatation of the main pancreatic duct and common bile duct were uncommon |
Vascular Involvement 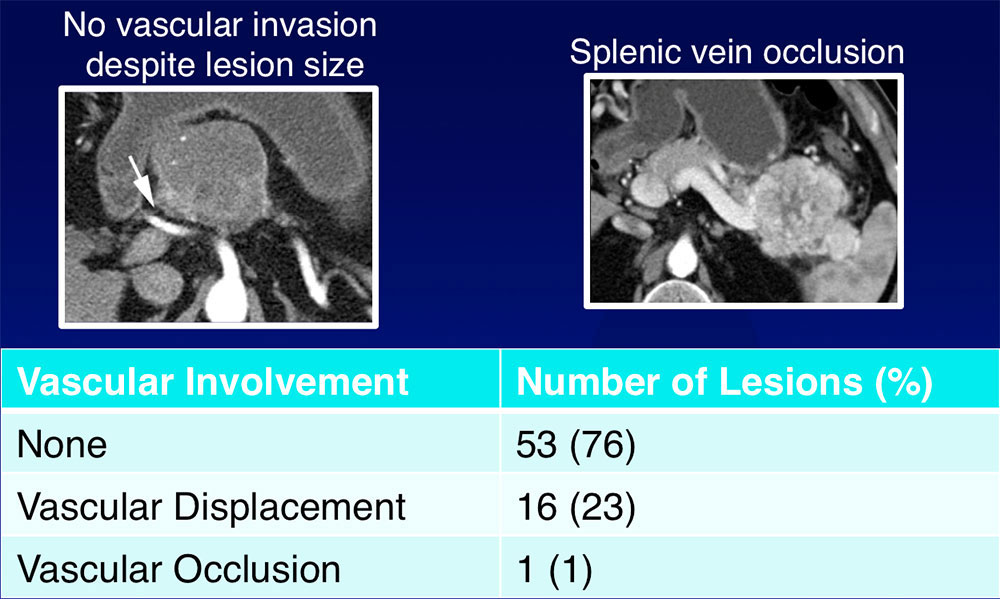
|
Additional Features
|
CT Attenuation 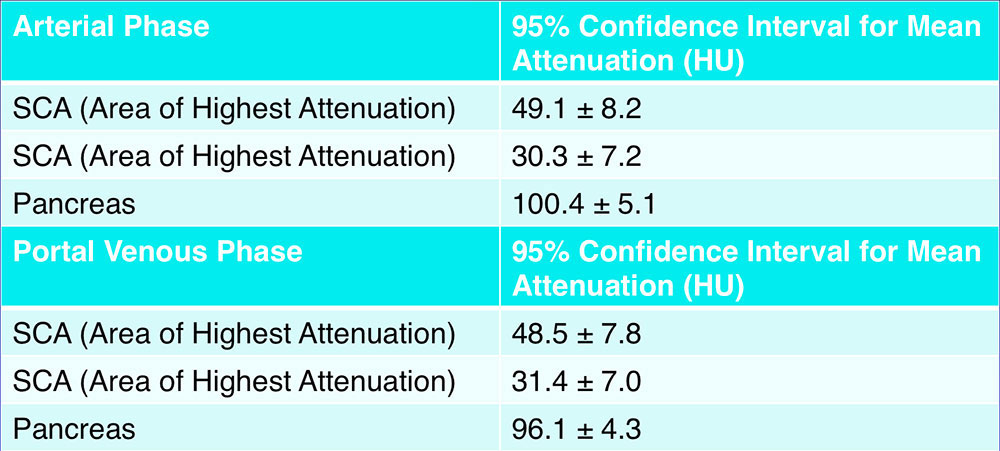 |
Subgroup Analysis
|
Subgroup Analysis 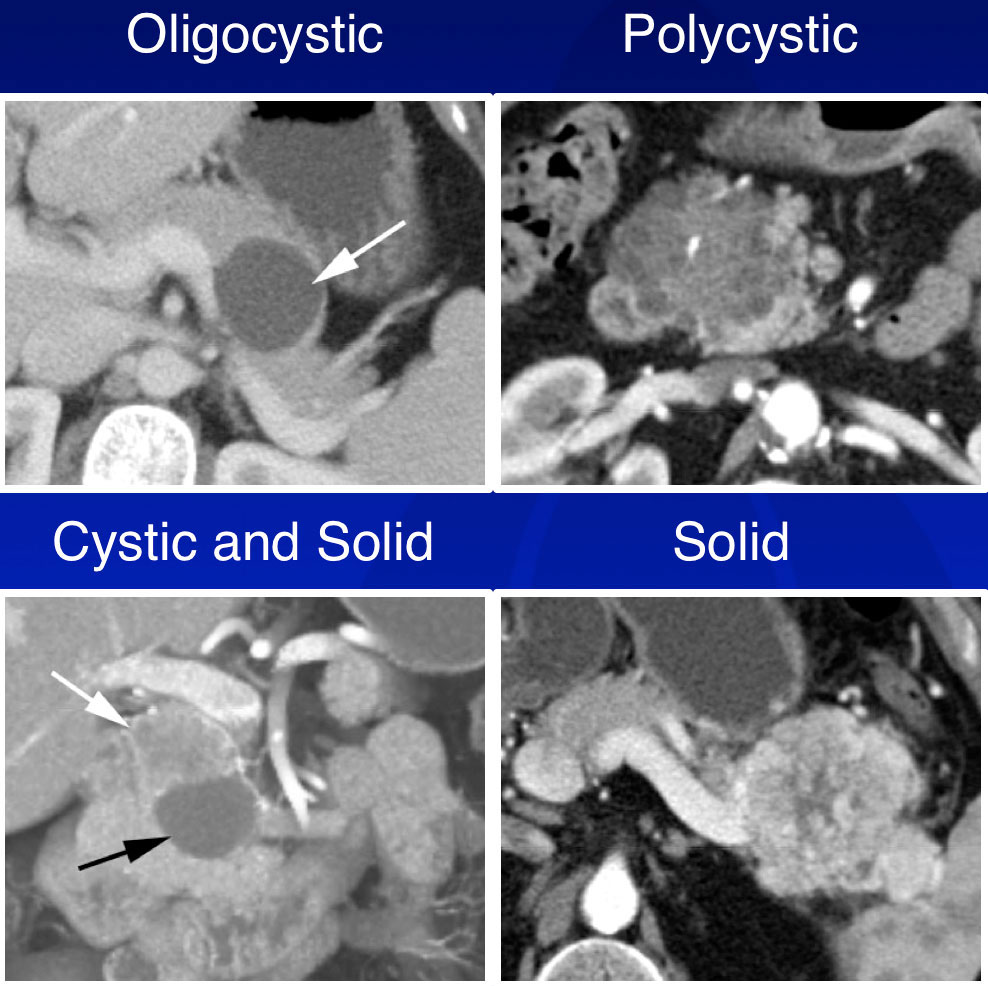 |
CT Attenuation of Subgroups – Arterial Phase 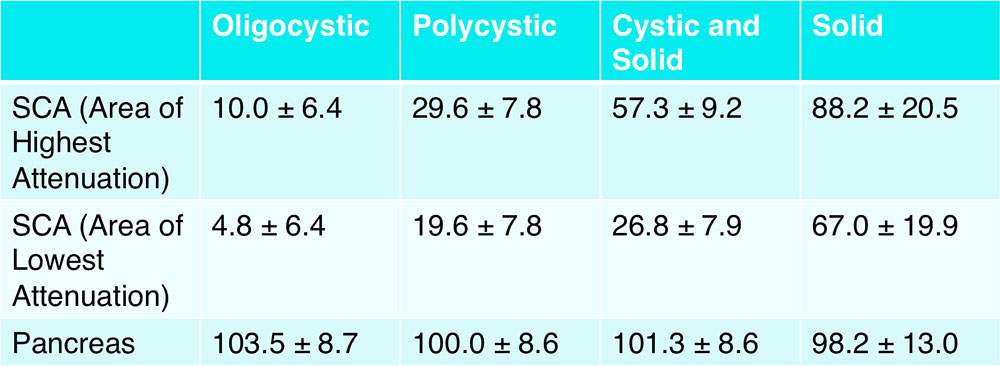 *95% confidence interval for mean attenuation |
CT Attenuation of Subgroups – Portal Venous Phase 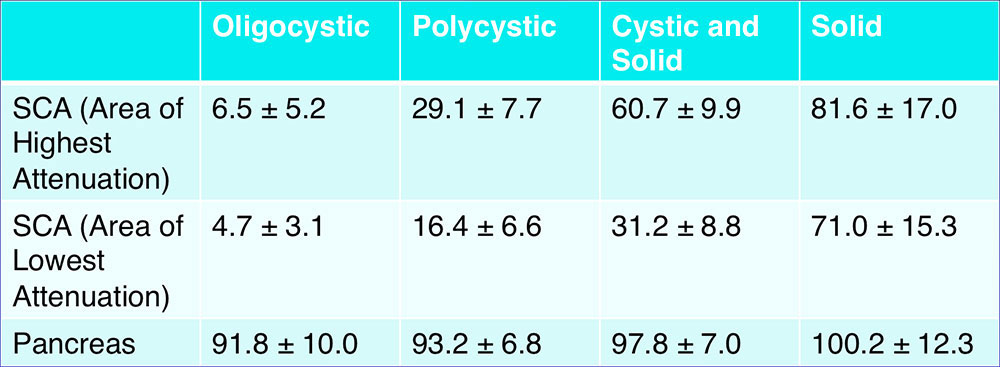 *95% confidence interval for mean attenuation |
Discussion 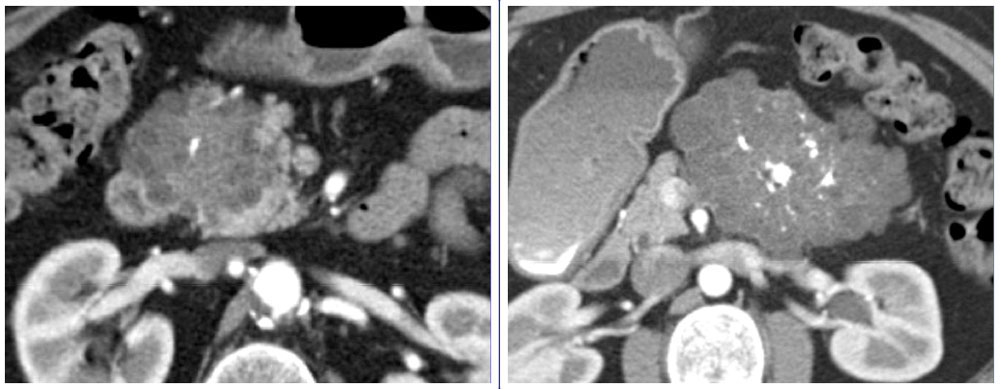
|
“Classic” Serous Cystadenoma – By Size
|
“Classic” Serous Cystadenoma – By Attenuation 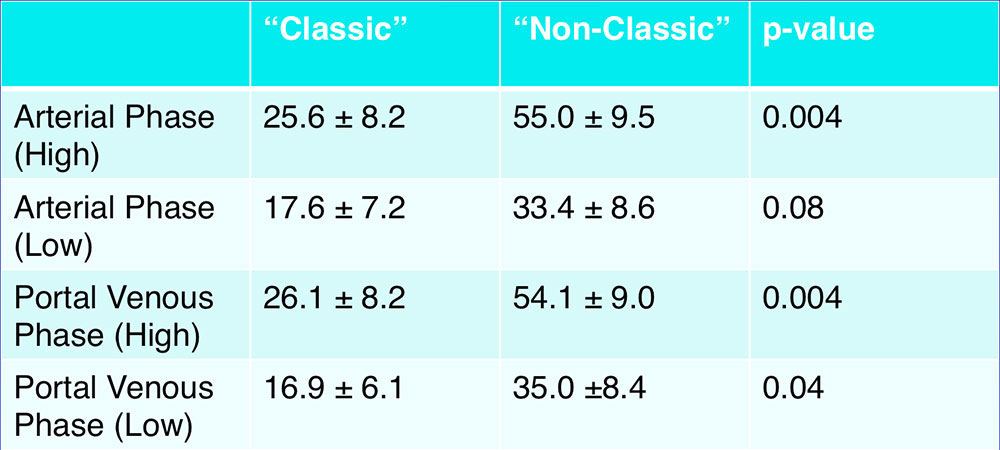 “Classic” SCAs demonstrated lower attenuation compared to “non-classic” SCAs |
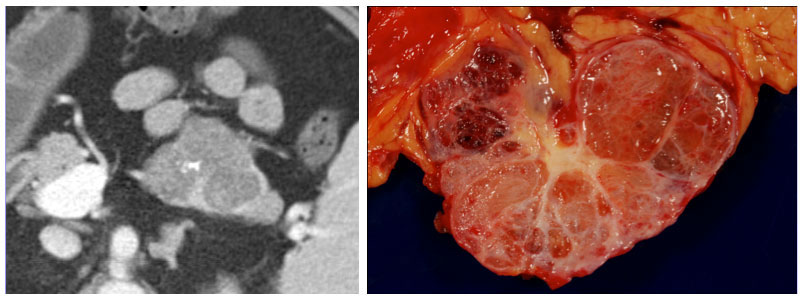
Correlation between CT Attenuation and Pathologic Classification
|
Correlation between CT Attenuation and Pathologic Classification
|
Correlation between CT Attenuation and Pathologic Classification 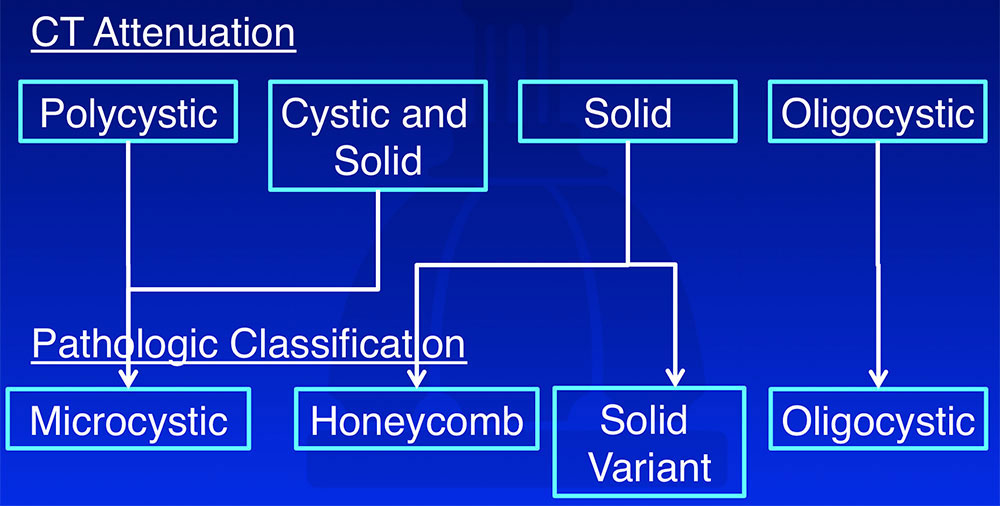 |
CT Attenuation As Compared to Other Cystic Pancreatic Lesions 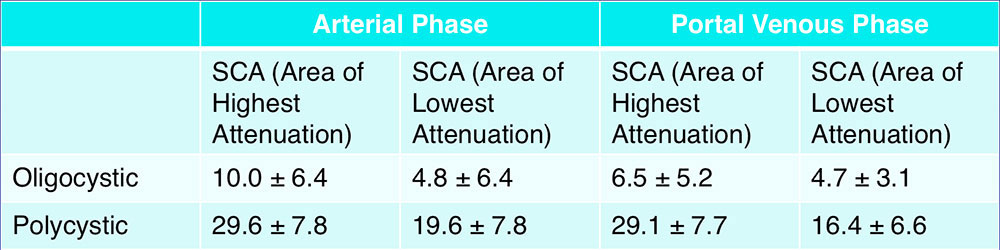 Chalian et al. (2011) reported mean CT attenuation values of unilocular cystic pancreatic lesions during the pancreatic parenchymal phase:7
|
Differentiating Oligocystic and Polycystic SCAs from Other Cystic Pancreatic Lesions
 |
Differentiating Oligocystic and Polycystic SCAs from Other Cystic Pancreatic Lesions
|
CT Attenuation As Compared to Other Solid Pancreatic Lesions 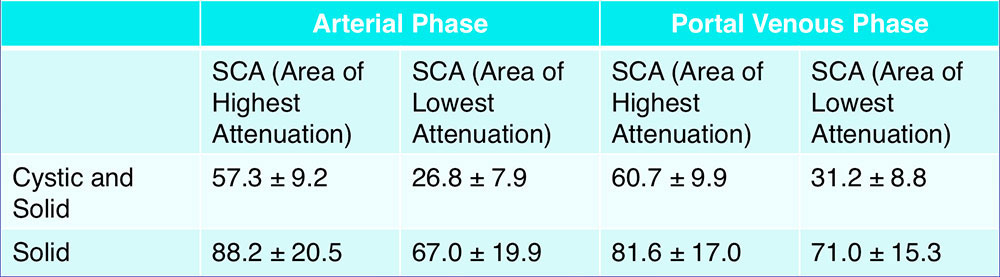
|
Differentiating Solid SCAs from Other Solid Pancreatic Lesions
|
Differentiating Solid SCAs from Other Solid Pancreatic Lesions
|
Management
|
Management
|
Strengths of the Current Study
|
Weaknesses of the Current Study
|
Conclusions
|
Conclusions
|
References
Acknowledgements
|